Dashboard Overview
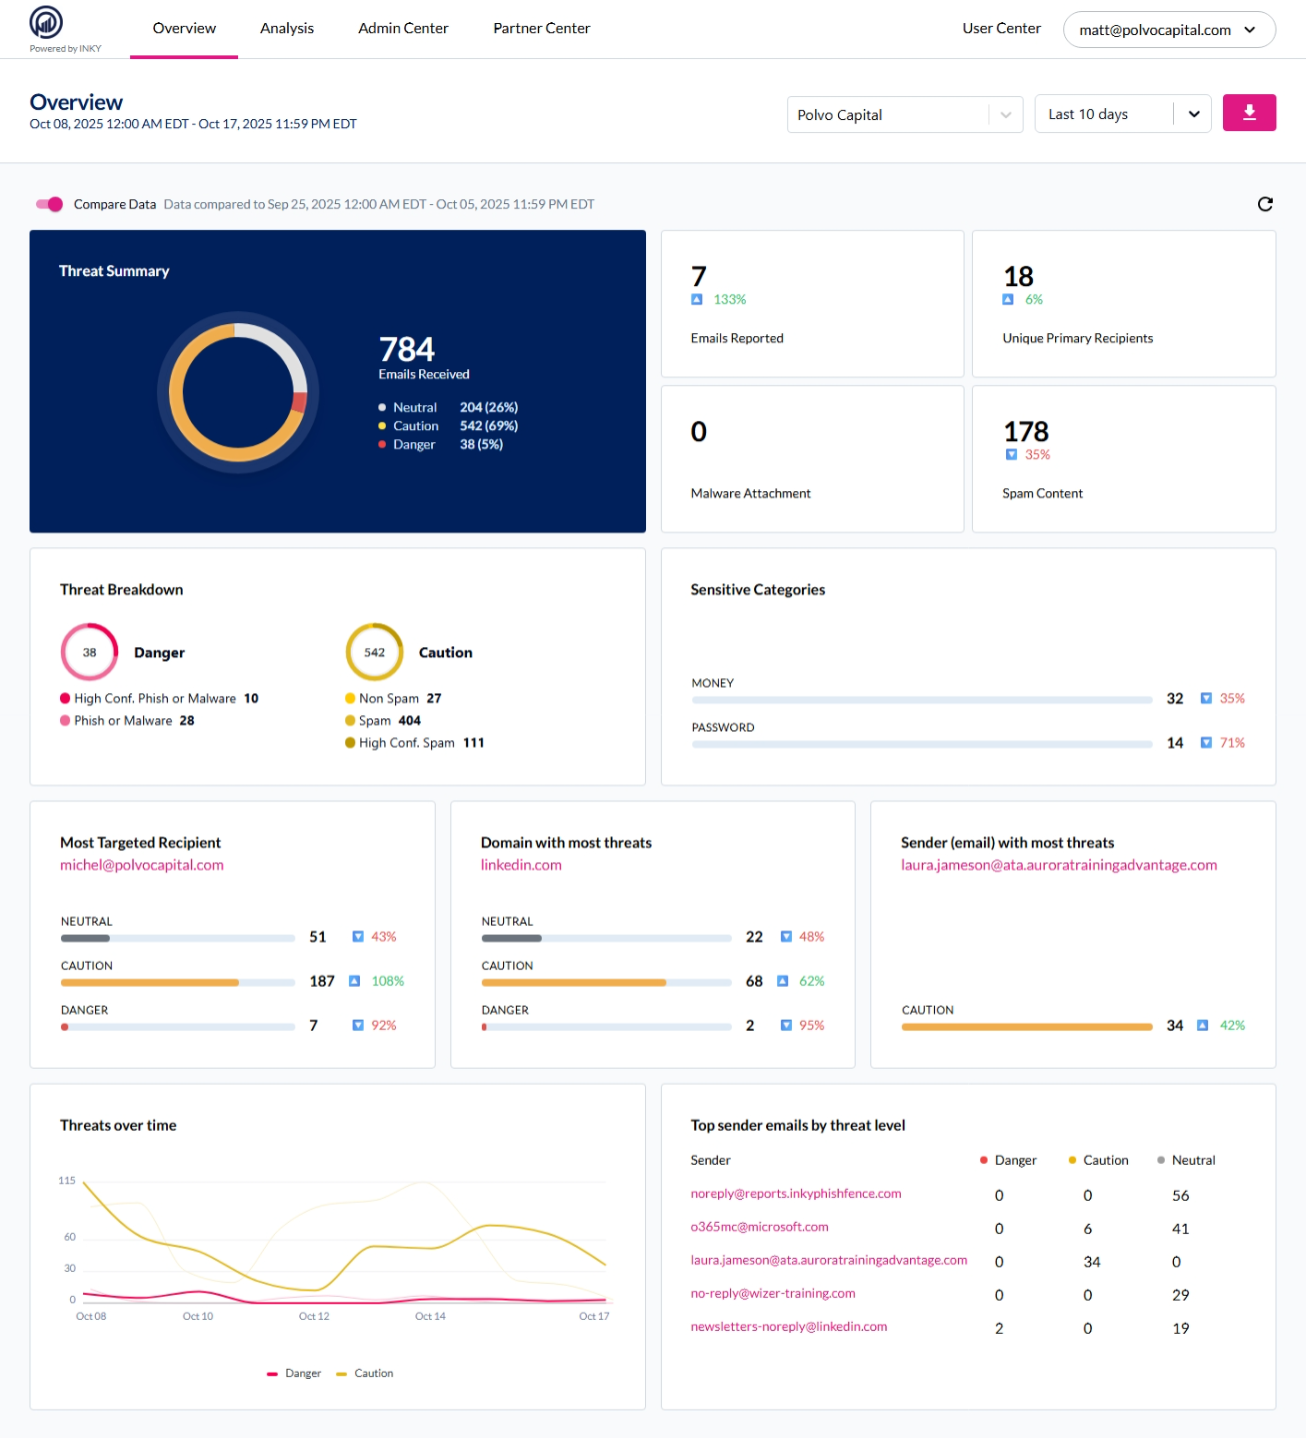
The Overview page is your security command center—see threat trends, user reporting activity, and attack patterns at a glance.
Written By Matt Sywulak
Last updated 7 months ago
Controls
Team Selector - Switch between organizations or child teams (MSP view)
Time Range - Filter data by preset ranges (Last 10 days, Last month, etc.) or custom dates
Compare Data - Toggle to compare current period against previous timeframe (shows percentage changes)
Download - Export dashboard data as PDF
Key Metrics
Threat Summary
Circle chart showing total emails received and threat distribution:
Neutral - Mail with no threats detected
Caution - Suspicious indicators (spam, lookalikes, unusual requests)
Danger - Confirmed phishing, malware, or high-confidence threats
Emails Reported
Number of threats users reported via Quick Action links. Percentage shows trend vs. previous period (green = increase, red = decrease).
Unique Primary Recipients
Count of individual users who had mail processed by INKY. Indicates how broadly INKY is protecting your organization, even if many recipients receive mostly neutral mail.
Malware Attachment
Emails containing malicious files or executable attachments detected by INKY.
Spam Content
Emails flagged as spam. Higher percentages indicate increased spam volume.
Detailed Views
Threat Breakdown
Splits Danger and Caution categories into subcategories:
Danger: High Conf. Phish or Malware, Phish or Malware
Caution: Non Spam, Spam, High Conf. Spam
Sensitive Categories
Emails flagged for money requests or password/credential mentions. Key indicators for BEC and credential phishing.
Most Targeted Recipient
User receiving the most threats, broken down by Neutral/Caution/Danger. Identifies high-risk users.
Domain with Most Threats
External domains sending the most malicious emails. Use this to build Advanced Block List rules.
Sender (email) with Most Threats
Specific email addresses sending threats. Shows Caution-level attacks only (Danger emails are auto-quarantined).
Threats Over Time
Line graph tracking Danger and Caution volumes daily. Spot spikes indicating active campaigns.
Top Sender Emails by Threat Level
Table showing top 5 senders with Danger/Caution/Neutral counts. Click sender to filter Observations view.
Navigation
Every widget is clickable. Click any metric, card, or table row to jump to the Observations page with that filter pre-applied. Examples:
Click Spam Content → View all spam emails
Click MONEY → View all money-request threats
Click a sender in Top Sender Emails → View all emails from that sender
Click Domain with Most Threats → View all emails from that domain